javascriptとsvgで波のアニメーションを作成しました
2022年1月9日
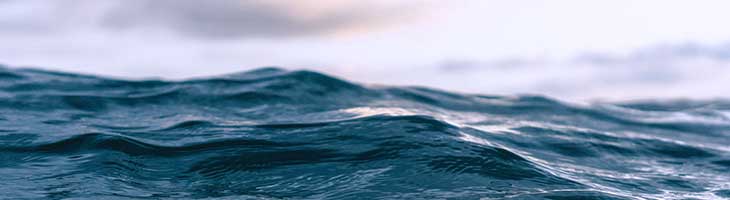
javascriptとsvgで波のアニメーションを作成しました。
ただ、SVGのpathのanimateに、適当な数字のパラメータのベジェ曲線を作って入れるだけです(語彙力)。
波といえるのか微妙ですが、以下です。
<svg width="100%" height="400" version="1.1" xmlns="http://www.w3.org/2000/svg" id="wave_svg">
  <linearGradient id="wave_grad" x1="0%" y1="0%" x2="0%" y2="100%">
    <stop offset="0%" stop-color="#00B4DB" />
    <stop offset="100%" stop-color="#224488" />
  </linearGradient>
</svg>

<script>
"use strict";
let WaveAni = function (svg_id, debug_flg) {
  let svg  = document.getElementById(svg_id);
  /*
   points:[
    [(起点)y, (ベジェ曲線のハンドル)x1, y1, x2, y2, (終点)y], [...],[...]
  ]
  */
  let draw = function(points) {
    let rect = svg.getBoundingClientRect(),
        width = rect.width,
        height = rect.height,
        h = Math.floor(height) * 0.1,
        w = Math.floor(width) * 0.1,
        y_center = h * 5,
        v = "";

    let path = document.createElementNS('http://www.w3.org/2000/svg','path');
    path.setAttribute('d', '');
    path.setAttribute('fill','url(#wave_grad)');
    path.setAttribute('style','opacity:0.8;');

    if (debug_flg) {
       // console.log(h);
       // console.log(w);
       debug_grid(svg, h, w);
    }

    let cnt = points.length;
    let i, v_tmp, v_start_y, v_x1, v_y1, v_x2, v_y2, v_end_y, colors = ["red","blue","green","yellow","purple"];
    for (i = 0; i < cnt; i++){
      // (起点)y, (ベジェ曲線のハンドル)x1, y1, x2, y2, (終点)y
      v_start_y = y_center + (h * points[i][0]);
      v_x1      = w * points[i][1];
      v_y1      = y_center + (h * points[i][2]);
      v_x2      = w * points[i][3];
      v_y2      = y_center + (h * points[i][4]);
      v_end_y   = y_center + (h * points[i][5]);
      v_tmp = "M 0 " + v_start_y + " C " + v_x1 + "," + v_y1 + " " + v_x2 + "," + v_y2 + " " + width + "," + v_end_y + " V " + height + " H 0 Z;";

      if (debug_flg) {
        debug_path(svg, v_tmp, colors[i]);
        debug_line(svg, 0, v_start_y, v_x1, v_y1, "red");
        debug_line(svg, v_x2, v_y2, width, v_end_y, "red");
      }

      if (i > 0) v += " ";
      v += v_tmp;
    }

    let animate = document.createElementNS("http://www.w3.org/2000/svg","animate");
    animate.setAttribute('attributeName', 'd');
    animate.setAttribute('dur', '15s');
    animate.setAttribute('repeatCount', 'indefinite');
    animate.setAttribute('values', v);
    path.appendChild(animate);

    svg.appendChild(path);
    //animate.beginElement();
  };
  let debug_grid = function(svg, h, w) {
    let path = document.createElementNS('http://www.w3.org/2000/svg','path');
    let d = "", i;
    for (i = 0; i <= 10; i++) {
      d += "M 0 " + h * i + " H " + w * 10 + " " +
           "M " + w * i + " 0 V " + h * 10 + " ";
    }
    path.setAttribute('d', d);
    path.setAttribute('stroke', 'black');
    path.setAttribute('fill','transparent');
    path.setAttribute('stroke-dasharray','2');
    path.setAttribute('style','opacity:0.5;');
    svg.appendChild(path);
  };
  let debug_path = function(svg, d, color) {
    let path = document.createElementNS('http://www.w3.org/2000/svg','path');
    path.setAttribute('d', d);
    path.setAttribute('stroke', color);
    path.setAttribute('fill','transparent');
    //path.setAttribute('stroke-dasharray','10');
    path.setAttribute('style','opacity:0.75;');
    svg.appendChild(path);
  };
  let debug_line = function(svg, x1, y1, x2, y2, color) {
    let line = document.createElementNS('http://www.w3.org/2000/svg','line');
    line.setAttribute('x1', x1);
    line.setAttribute('y1', y1);
    line.setAttribute('x2', x2);
    line.setAttribute('y2', y2);
    line.setAttribute('stroke', color);
    line.setAttribute('stroke-dasharray','2');
    line.setAttribute('style','opacity:0.75;');
    svg.appendChild(line);
  };
  return {
    draw: function(points) {
      draw(points);
    }
  };
}
let wave = WaveAni('wave_svg', 0);
wave.draw([[1, 3, 1, 6, -2, -0.5],
           [0, 4, -2.5, 6, 0.5, 1],
           [-1, 4, 2, 7, -1, -1.5],
           [1, 3, 1, 6, -2, -0.5]]);
wave.draw([[0, 4, -2.5, 6, 0.5, 1],
           [-1, 4, 2, 7, -1, -1.5],
           [1, 3, 1, 6, -2, -0.5],
           [0, 4, -2.5, 6, 0.5, 1]]);
</script>